
Log dashboard (Grafana)
Group several projects together and chart their logs side by side on a shared Grafana dashboard — volume by level, errors over time, and the log lines themselves.
Every project streams its own output on its Logs page. When you need to watch several of them at the same time — an API, a worker, and a frontend that all go quiet together — put them in a project group, and NevTan charts their logs side by side on a shared Grafana dashboard.
Where to find it
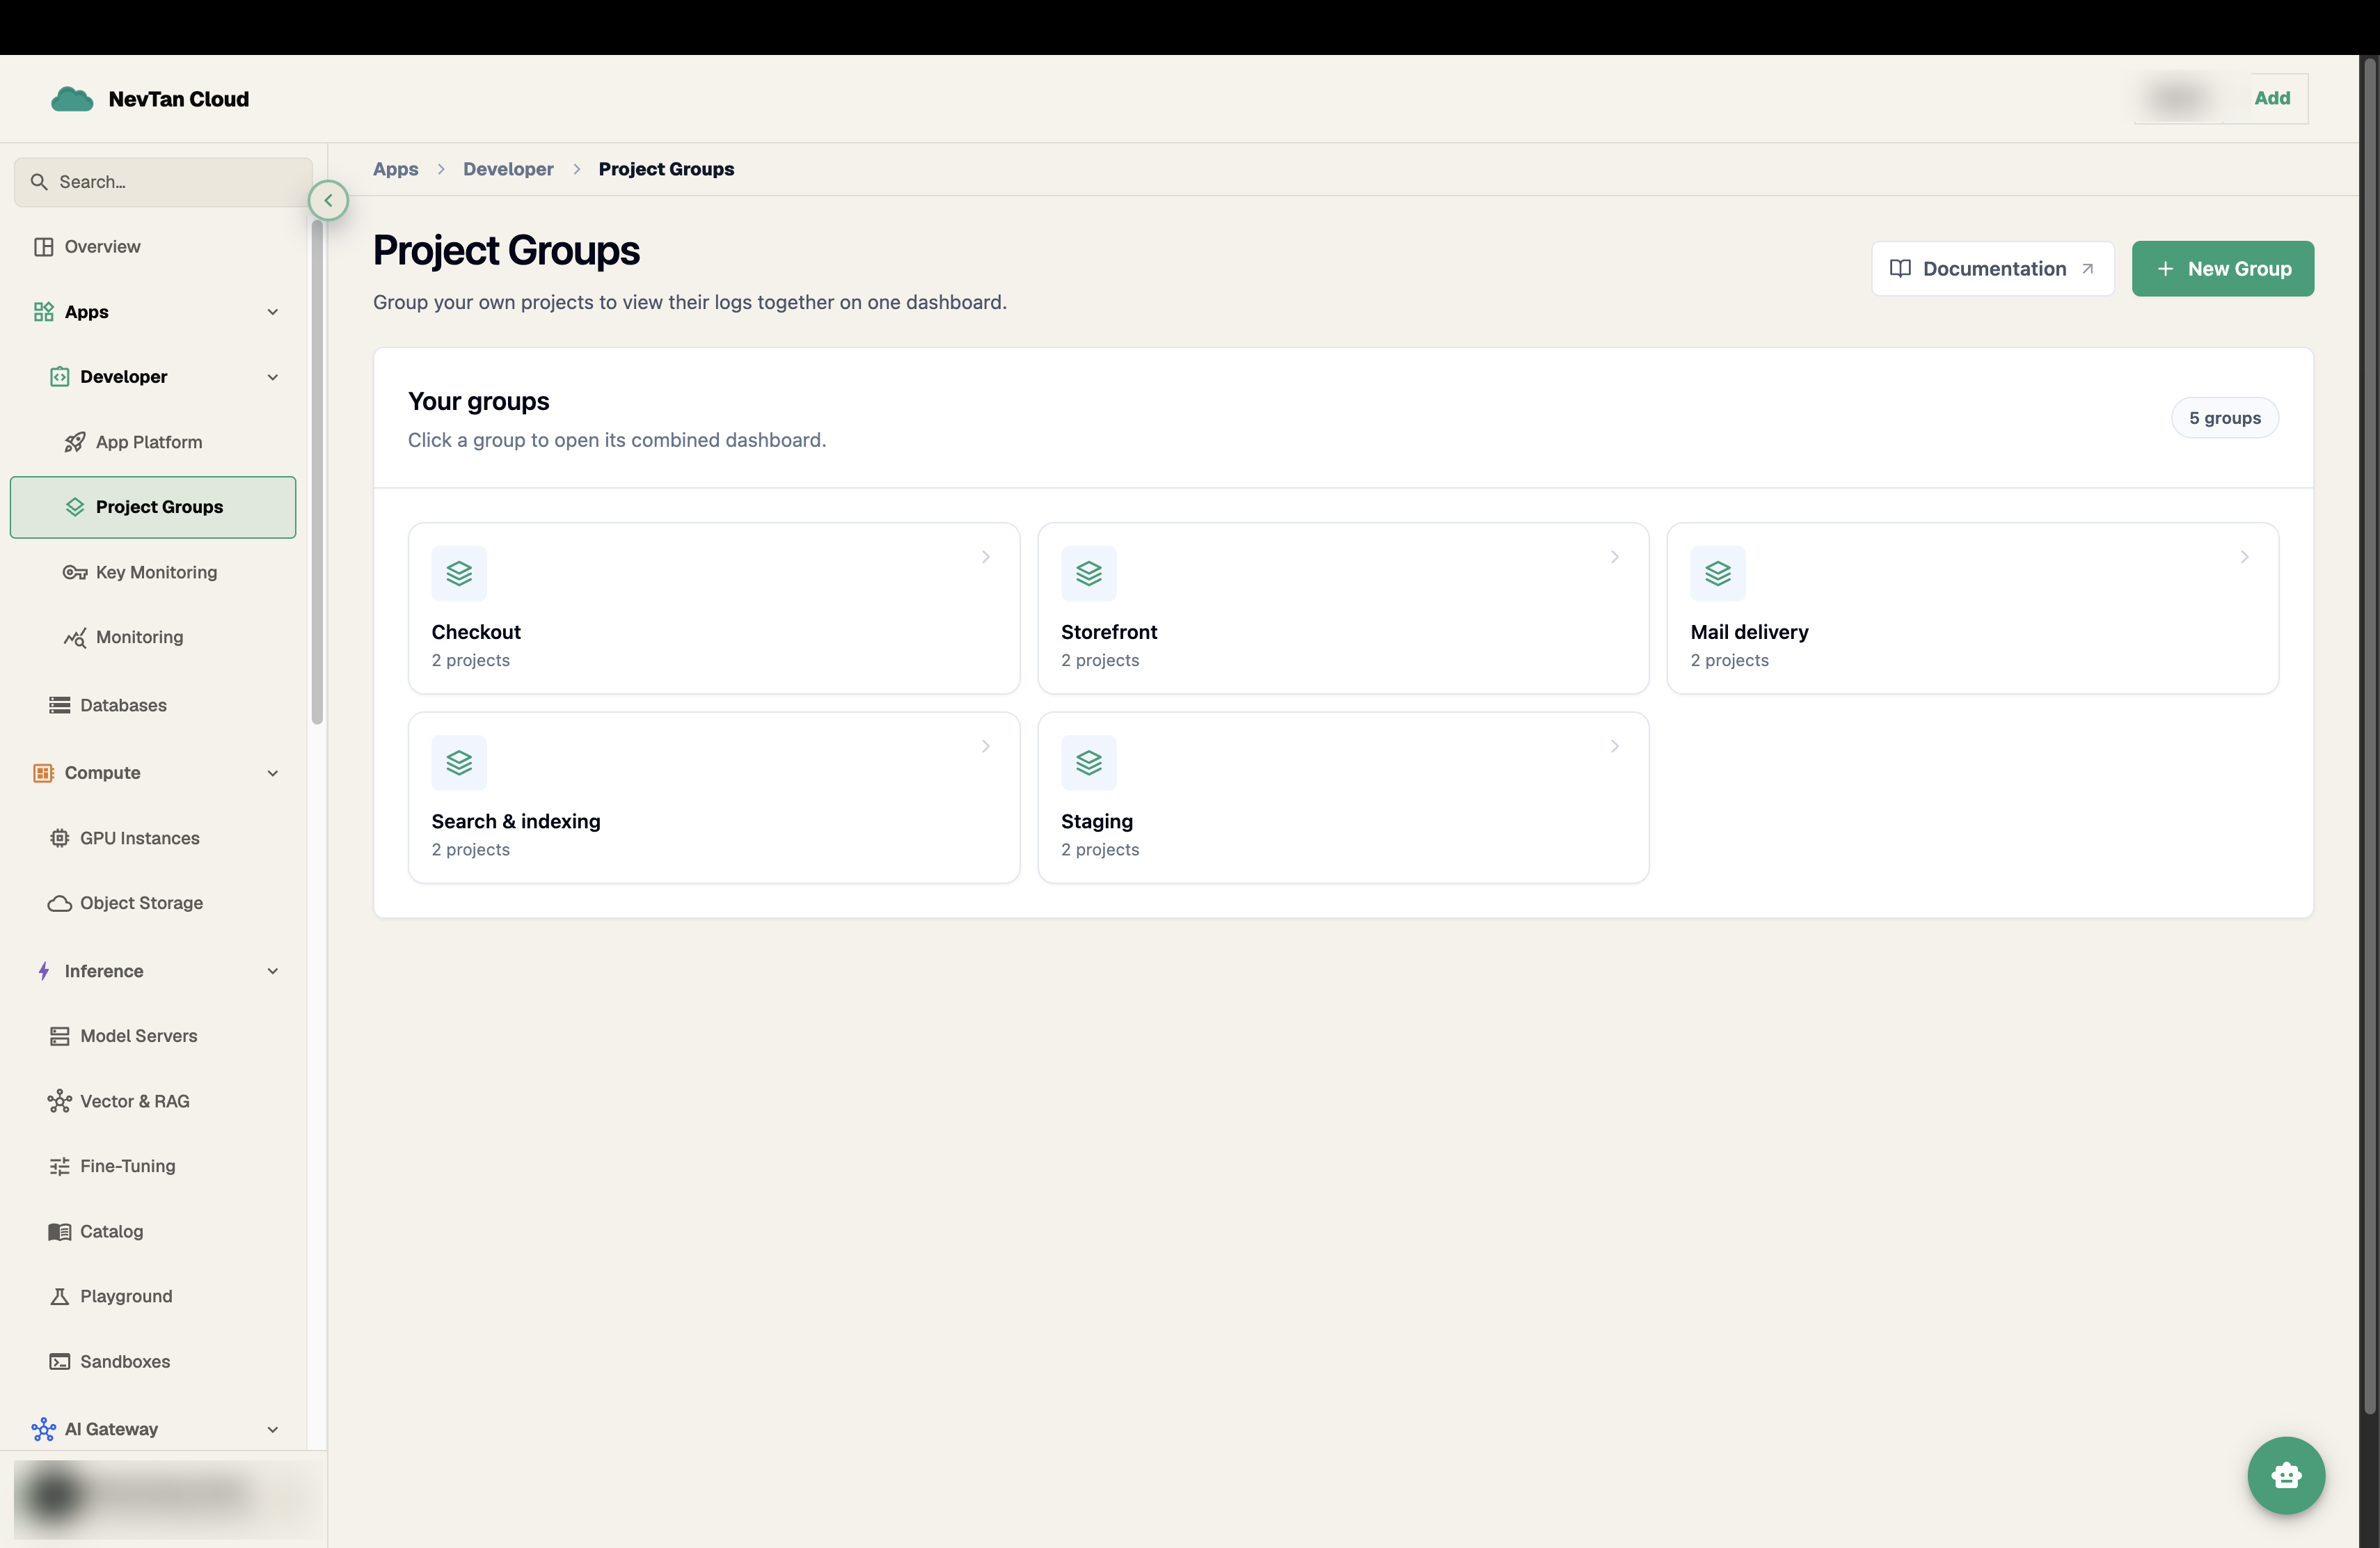
In the sidebar, open Developer → Project Groups. The page lists every group you have created — each card shows the group name and how many projects are in it. Click a card to open that group's combined dashboard, or New Group to make one.
Create a group
- 1Click New GroupFrom the Project Groups page. It opens a single form — there is no wizard and nothing gets provisioned, so creating a group is instant and costs nothing.
- 2Name itSomething you will recognise later — Backend Services, Checkout flow, Staging. Up to 60 characters, and you can rename it at any time.
- 3Pick the projectsTick every project whose logs belong on one dashboard. The list holds all of your projects with a search box above it, so a long list is not a problem. At least one project is required.
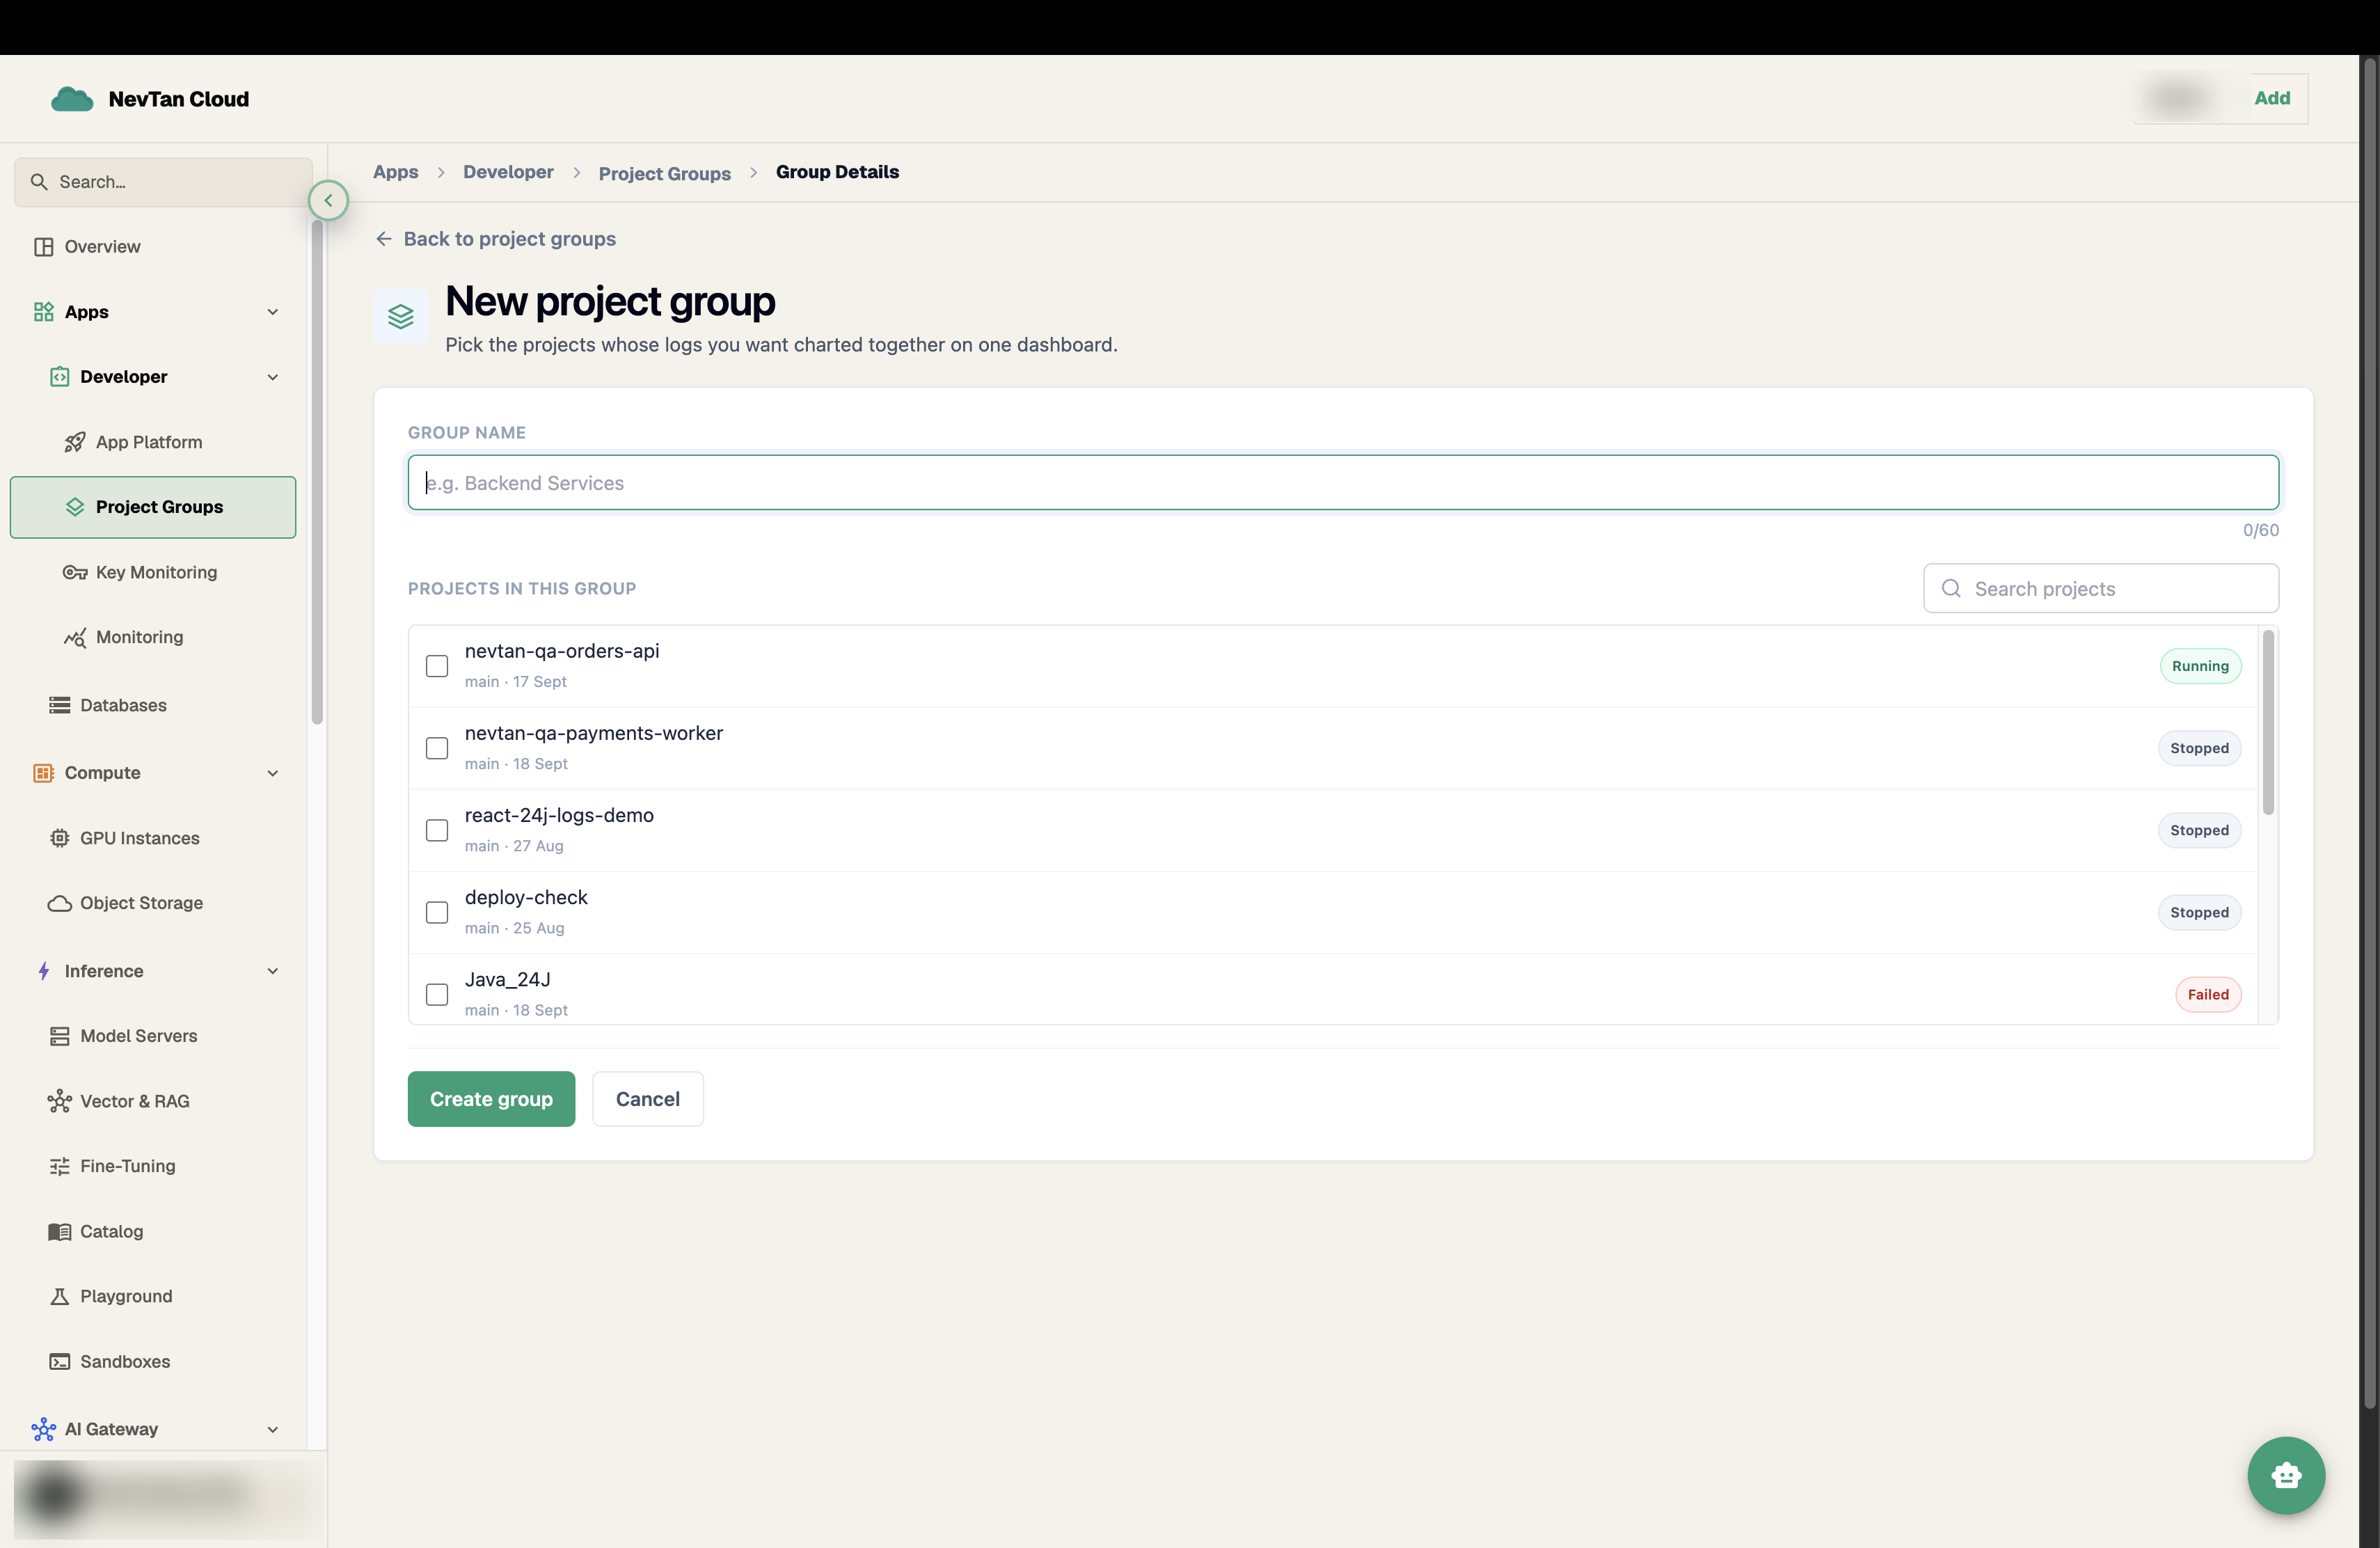
Name the group, tick the projects, create — that is the whole form. - 4Create the groupYou land straight on the group's page, with the combined dashboard already loading.
The combined log activity card
The group page opens on Combined log activity — the group's Grafana panels embedded in the console: a summary, a per-project breakdown, log volume by level, the level mix, and errors over time, all over the last hour. It is the real dashboard, not a picture of one, and it refreshes itself every 30 seconds.
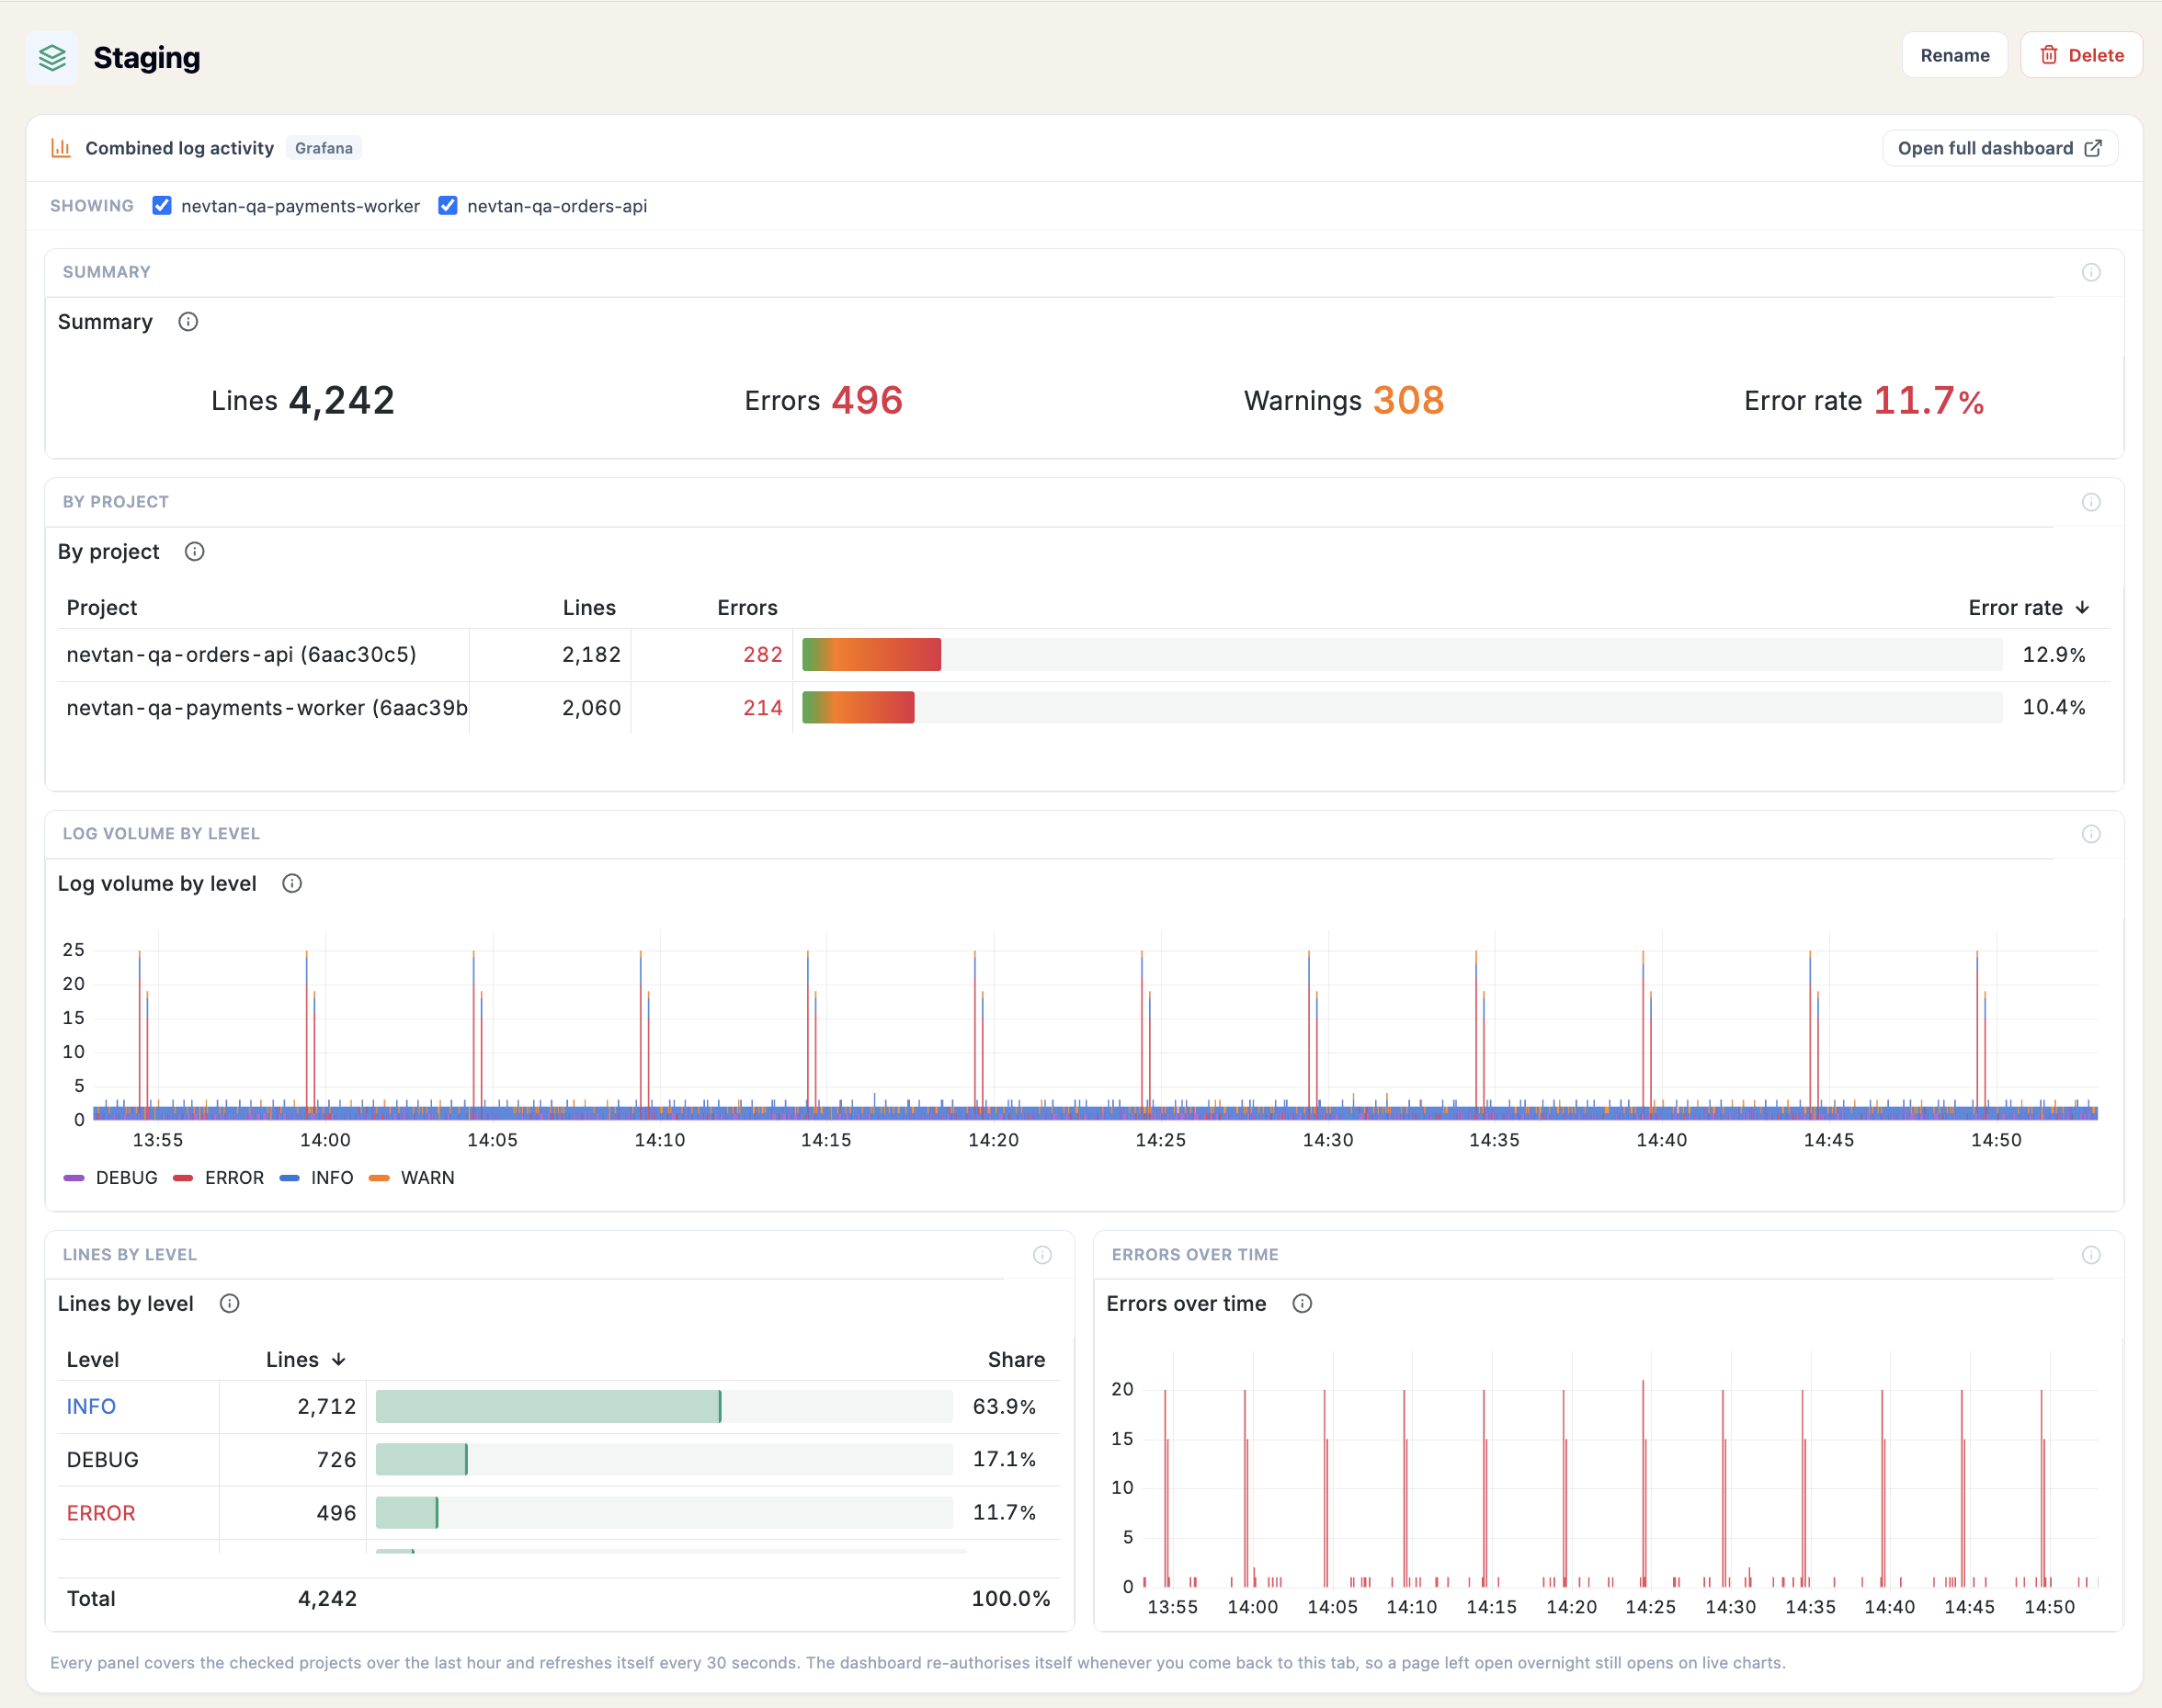
- Showing — one checkbox per project, so you can pull a noisy service out of the chart without leaving the page or removing it from the group. It appears once the group has more than one project with logs, and every project starts checked.
- Open full dashboard — opens the complete Grafana dashboard in a new tab (see below). It always charts the whole group, whatever the checkboxes say.
- This group's dashboard — the address the dashboard is served from, shown so you know where the tab you are about to open is going.
- Projects (n) — the member list underneath, where you add and remove projects.
Open the full dashboard
The card covers the charts. Open full dashboard opens the whole thing in a new tab — the same panels plus the log lines themselves, Grafana's own filter row across the top, and its Drilldown — already signed in, with no Grafana login to get past.
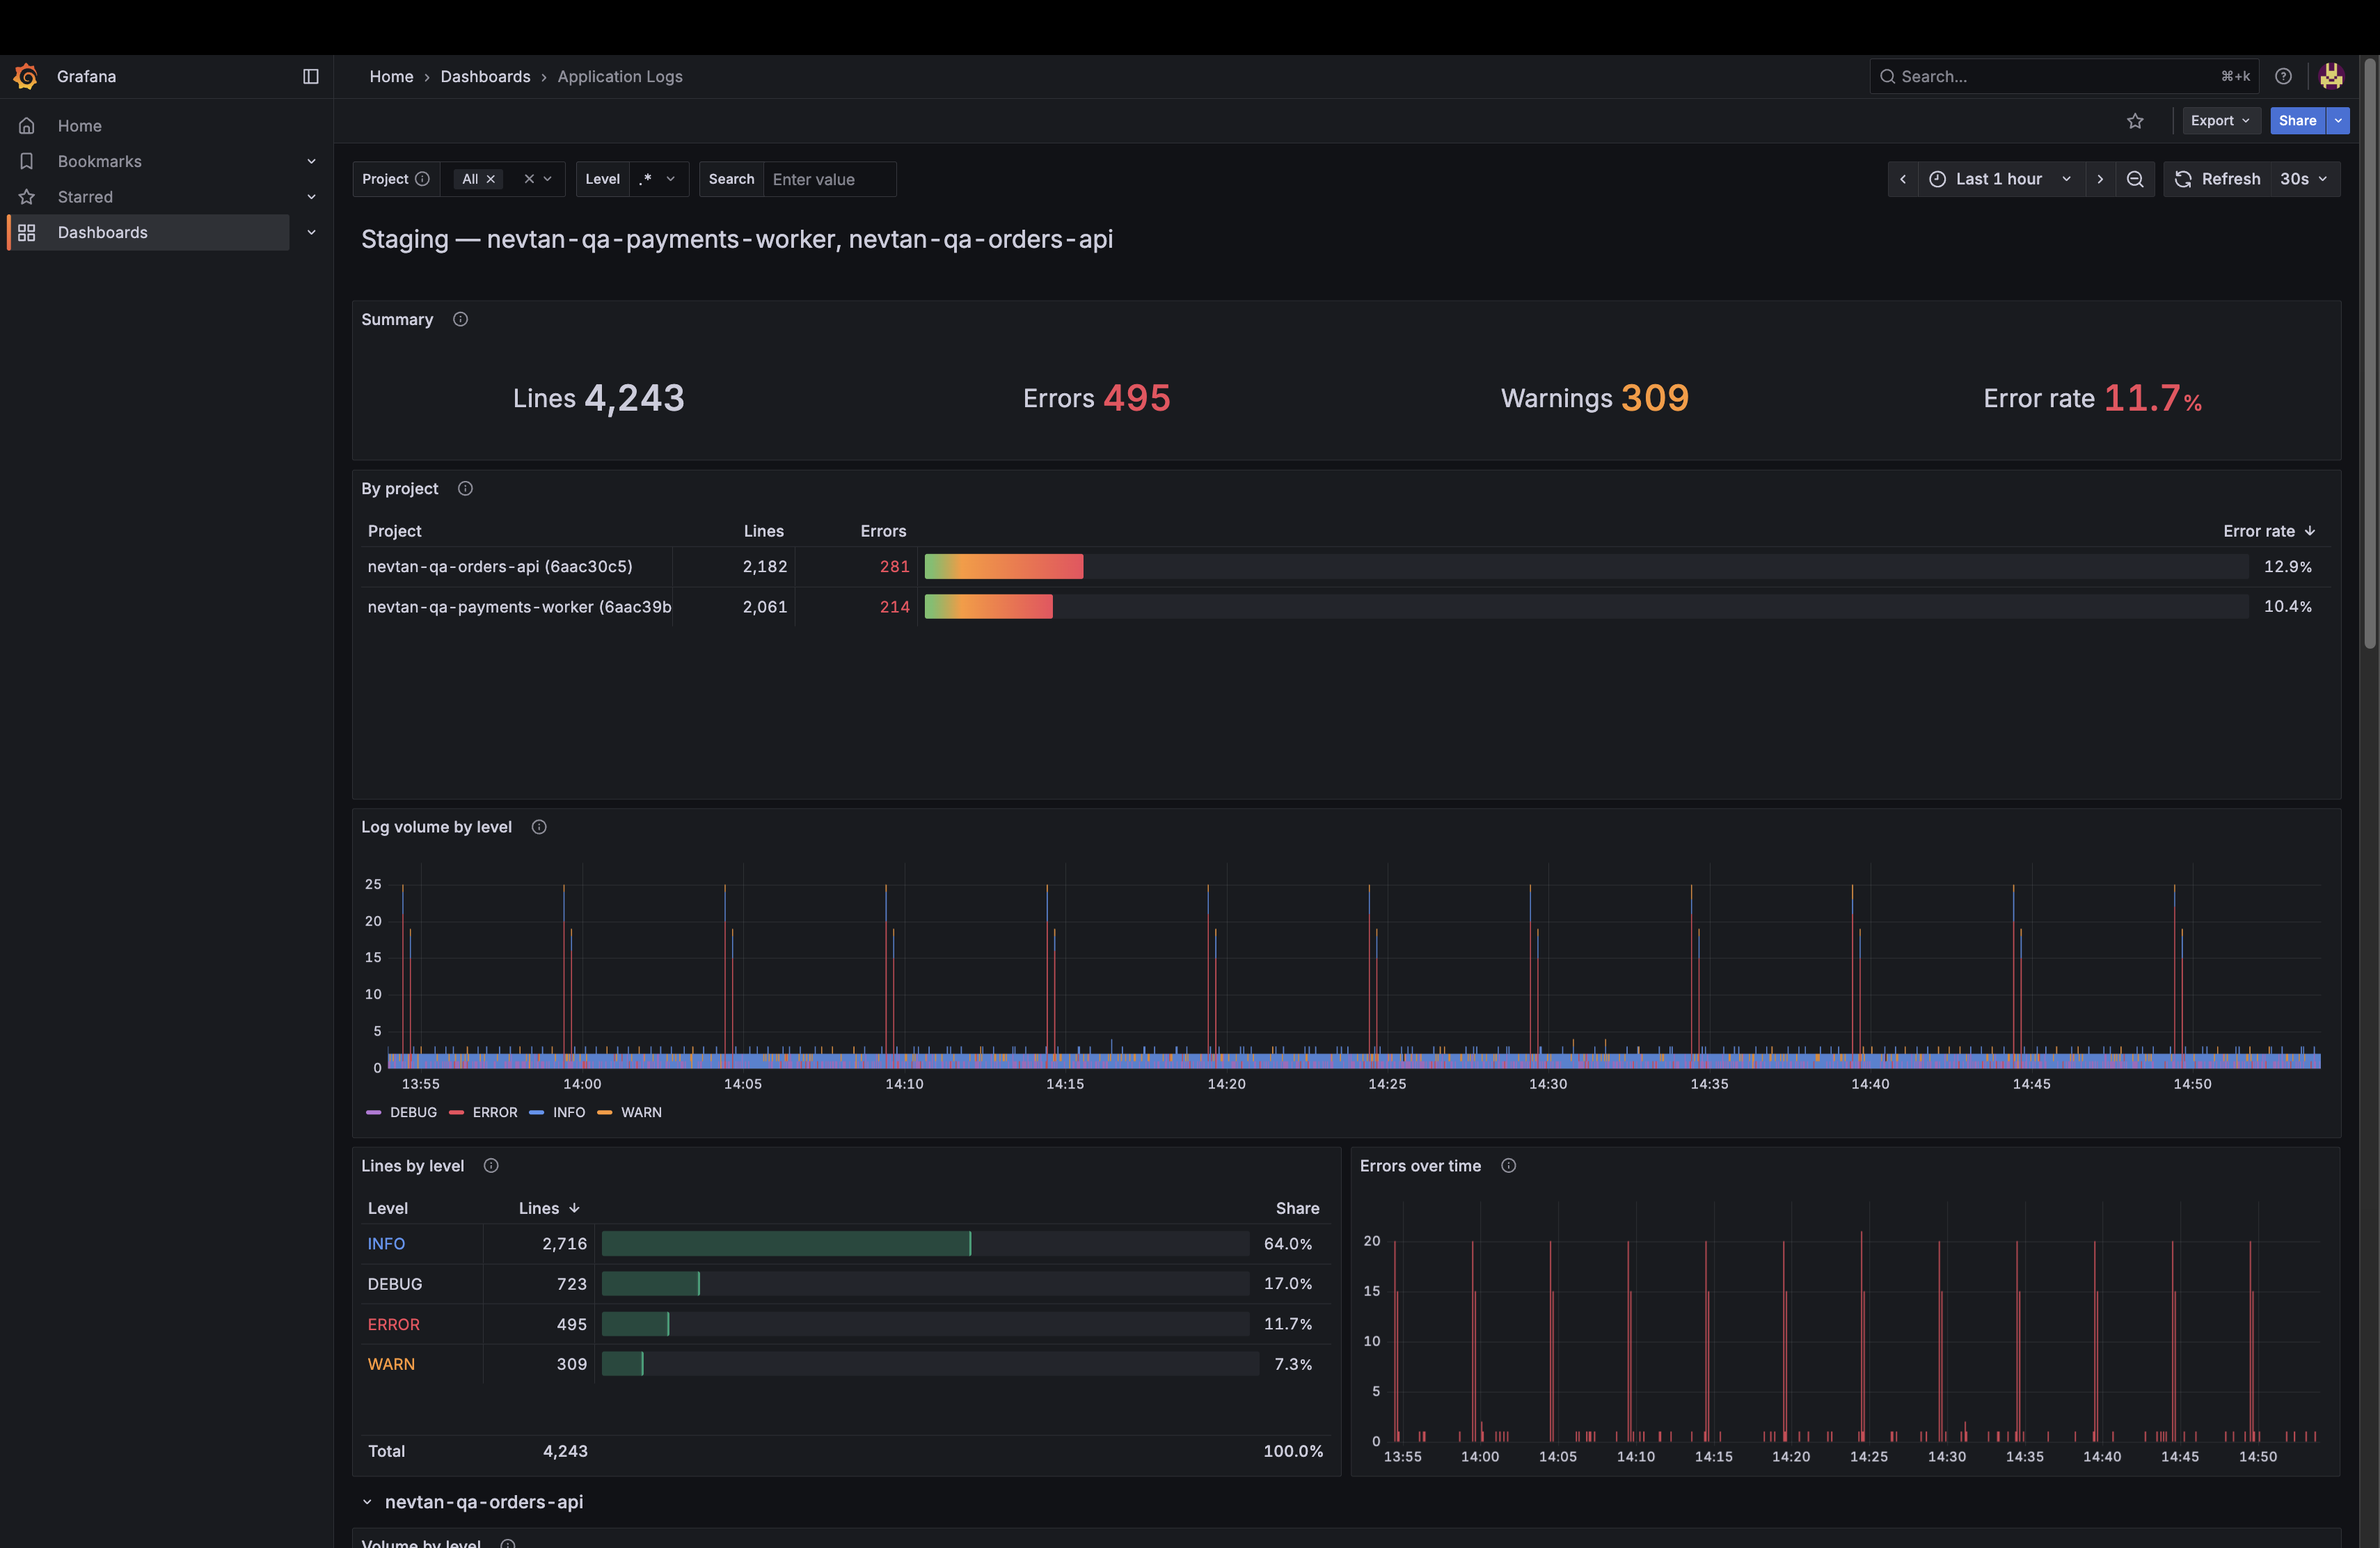
| Panel | What it tells you |
|---|---|
| Containers in this view | A line at the very top mapping each project name to the raw container ids being charted — Grafana itself only ever knows the container id, so this is where the names live. |
| Summary | Lines, errors, warnings, and the error rate for the selected time range. The fastest answer to "is anything wrong right now?" |
| By project | One row per project in the group, with its lines, errors, and error rate side by side. This is the panel that says which of your apps is the noisy one. |
| Log volume by level | Lines per level over time — the panel embedded on the group page. A spike here is a change in behaviour, not just a change in traffic. |
| Lines by level | The same range as a bar gauge, for when you want the proportion rather than the timing. |
| Errors over time | ERROR, FATAL, and CRITICAL only, so a small error rate is not flattened by normal INFO traffic. |
| Logs | The lines themselves, newest first, with timestamps. Click a line to expand its labels and see which container it came from. |
Narrowing the view
The dashboard is driven by four controls, and every panel obeys all of them at once:
| Control | Effect |
|---|---|
| Project | Which projects are charted, listed by name. The console fills this in from your group, which is why the panels are already scoped to your projects the moment the tab opens. |
| Level | One of ERROR, WARN, INFO, DEBUG, TRACE, FATAL, or .* for every level. |
| Search | A case-insensitive match against the line text — an order id, a stack-trace class, a path. |
| Time range | Grafana's own range picker. The dashboard opens on the last hour and auto-refreshes every 30 seconds. |
Managing a group
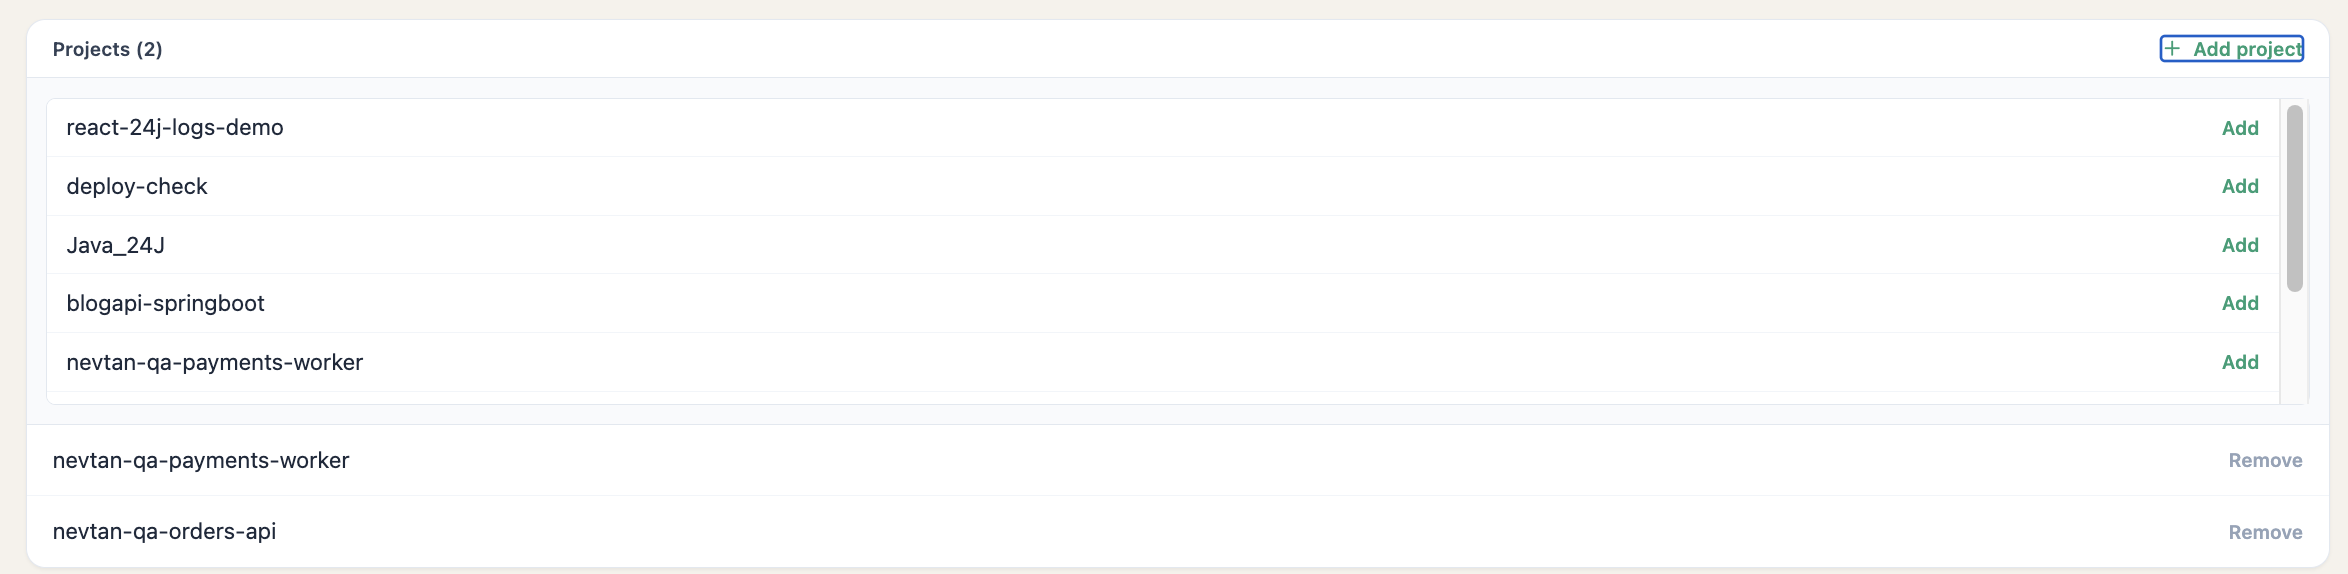
- Add project — in the Projects card header. It lists every project of yours that is not already a member; adding one puts its logs on the chart immediately.
- Remove — on any member row. This removes the project from the group only; the project, its deployment, and its own logs are untouched.
- Rename — top right of the group page.
- Delete — deletes the group and its combined view. Your projects keep running; nothing is deployed, stopped, or billed differently because of a group.
Access and privacy
You never sign in to Grafana yourself. When you open a group, the console asks for a short-lived signed link, and the gateway in front of Grafana exchanges it for a session as you — so the dashboard opens already signed in, and stays closed to everyone else.
- A group can only ever contain your own projects, and only you can open its dashboard.
- The link is valid for five minutes, and renews itself while you have the dashboard open — so a long debugging session never expires under you, while a link left lying around goes stale quickly.
- The URL you land on carries no credential, so it is safe to paste into a ticket or a chat. It does not let anyone else in — they open the dashboard from their own console and see their own resources.
Troubleshooting
| What you see | What it means |
|---|---|
| "Add a project below to start charting its logs here." | The group has no members yet. Use Add project. |
| "None of this group's projects have run a container yet, so there's nothing to chart." | The member projects have never started a container, so no logs have been collected. Deploy one and the chart fills in — see Deploy from git. |
| "Check at least one project above to chart its logs." | Every box in the Showing row is unchecked. Tick at least one. |
| "The log dashboard is not configured for this environment." | The log dashboard is switched off or not set up on this deployment of NevTan. Nothing about your project is wrong, and log collection carries on regardless. |
| The dashboard tab says the link has expired | The five-minute link aged out before it was opened. Go back to the group page and click Open full dashboard again — a fresh link is minted every time. |
| The chart is empty but the project is running | Either the time range is quieter than you expected (widen it), or the app writes its logs to a file instead of standard output — check the project's own Logs page to tell the two apart. |
Related
A single project's own live log stream, with level filters, search, download, and rollback.
What each panel shows, how to read it, and what a healthy reading looks like.
CPU, memory, and network for a deployed project — the numbers alongside these log lines.
Your own Grafana, Prometheus, Loki, or Uptime Kuma instance for infrastructure outside NevTan.